
It’s snowing. That’s all I have to say about it, I guess.
We went to the Avs game last week, and it was some edge-of-your-seat stuff. Tag is their number one fan, and we were hoping to see them start the season with a bang, but they lost in overtime—such a bummer.
It was a fun night, nonetheless. We met up with an old friend that we hadn’t seen in too long. That cheered Tag up some.
On Friday, one of my old clients was in town; she’s the one who lives in Florida now. We went out to eat, and it was nice to have a little visit.
Bridger got his first concussion. So, congrats to him. It happened while playing football, and we ended up in the ER. He wanted to go to a party the next day, but Tag said no way. That was a fun morning. We opted out of the CT scan after the doctor told us there was a 2% chance he’d get cancer later in life. I’m not sure that’s uber-accurate, but we didn’t do it anyway since he wasn’t showing any signs that something more troubling was going on. He never lost consciousness. That was his last football game of the season, thank goodness.
Goodbye football, hello baseball. That’s starting up in November, and it’s club-level, so that’s cool, but a lot of driving around.
And Sterling didn’t want to be left out, so he decided to get his very own head trauma. He missed the bus last week and I had to take him to school and he was waving his goodbyes to me as I was pulling away and he turned around and walked straight into the brick wall. He’s got a huge gash on his forehead. Likely a scar, too. Poor thing.
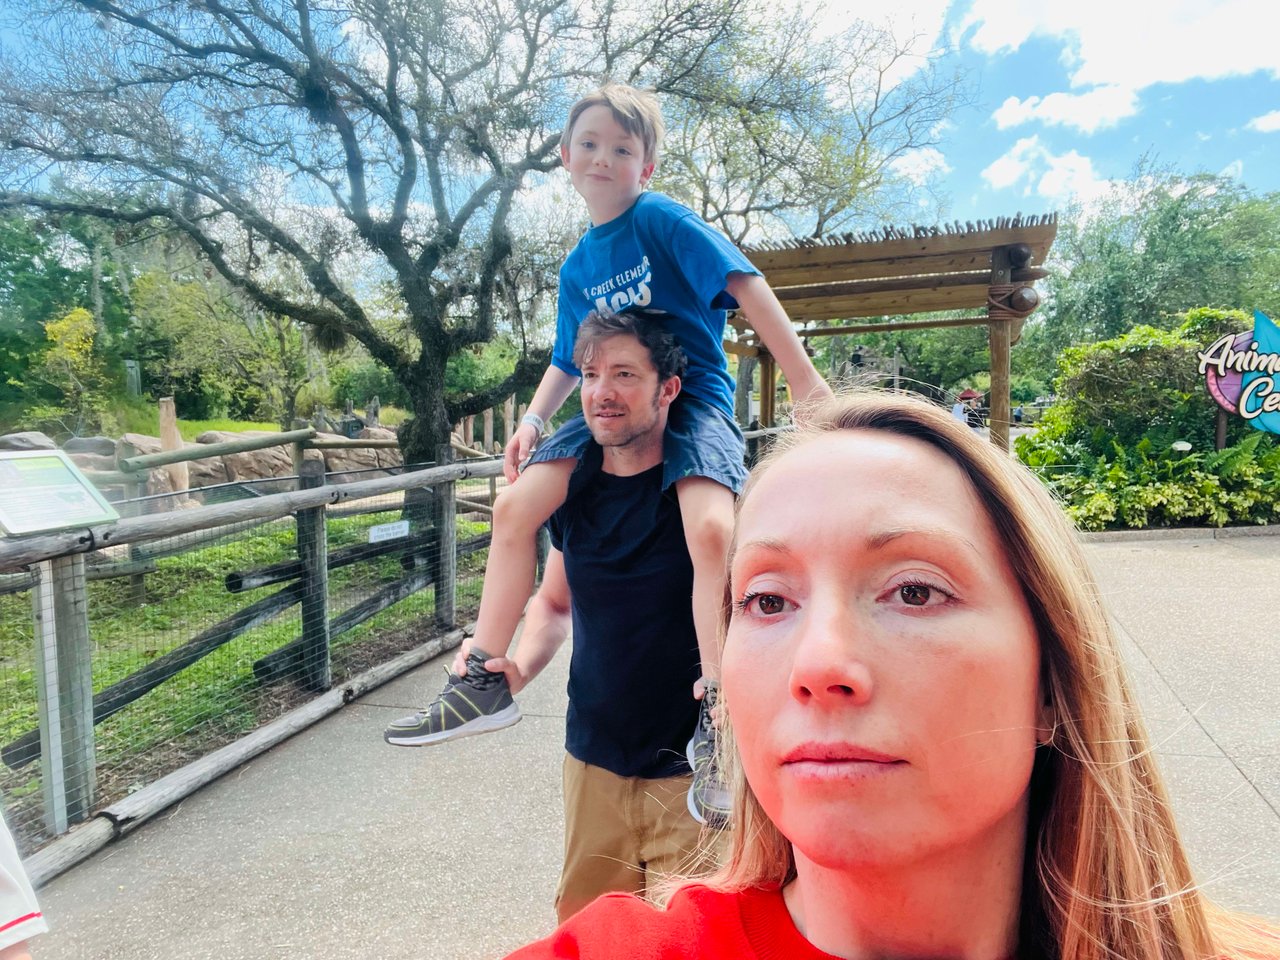
But, not to fret, he was good enough to go to the zoo with his class shortly thereafter. I chaperoned and it was a sweet event and a good way to end the week after all the concerning injuries.
PSA: If you guys haven’t gone to a pumpkin patch yet, you may be too late if the end goal is to get pumpkins. We went to Chattfield over the weekend and they were totally out. I (and the kids) still enjoyed some fall stuff, like hayrides, funnel cakes, and barrel rides. So, you can take part in the events, just not the pumpkin picking.
My Real Estate Status
I had one showing with some buyers at the end of last week; it was kind of a dud. To make up for it though, I went to Fairplay to check out my new land listing and it’s incredible. I mean, a great location that offers private fishing for just the residents of the subdivision and private hunting rights, too.
I stuck around the area to grab a bite and overheard some people talking about the subdivision I had just come from, so I introduced myself and we had a nice chat. Turns out they are also Keller Williams but agents from Austin. They started building a home in the same subdivision as my new land listing and they are just wrapping it up, 2.5 years later. In the meantime they purchased a ranch down the road and no longer need the full use of the new build so they are interested in selling partial shares. A cool new concept. I have seen this being done with properties in Summit County. We are going to stay in touch and then I may be listing some partial shares of a sweet new build in Fairplay. Stay tuned…
New Land Listing In Fairplay, CO
Current Denver Area Real Estate Market
“The market continues to shift into a lower gear as the holidays approach and it's important that we take a deeper dive into The Odds of Selling. When I look at The Odds of Selling, I'm taking into account all of the available homes for sale vs. those that go under contract and or close and project it forward for a 30 day period of time. Looking at the numbers on a weekly basis going back to the beginning of 2020 don't give us the correct perspective on where we should be at this time of year. The Odds of Selling this week dropped to 45.2% for the next 30 day period.
Taking a more historical approach to The Odds of Selling and looking back at our traditional real estate cycle from 2013-2019 where we also hovered around 2.0 months of inventory we are not that far off from where we should be at this time of year. This graph shows The Odds of Selling going back to 2013-2019 for the month of October was 49.4% on average. While this year has been fraught with affordability and interest rate challenges this is a return to a more 'normal' market experience post The Great Recession.
We are still waiting for the purge of active inventory in our market, usually by the end of September we see a jump in expired and withdrawn transactions. This purge hasn't happened yet keeping our inventory levels higher than average heading into Q4. This purge of inventory is what drives our spring market, if inventory remains high we may continue to see significant price reductions into the last part of 2022 and the beginning of 2023. We will know more about inventory in next week's market update. Stay tuned.”

3 Graphs Showing Why Today's Housing Market Isn't Like 2008

With all the headlines and talk in the media about the shift in the housing market, you might be thinking this is a housing bubble. It’s only natural for those thoughts to creep in that make you think it could be a repeat of what took place in 2008. But the good news is, there’s concrete data to show why this is nothing like the last time.
There’s Still a Shortage of Homes on the Market Today, Not a Surplus
For historical context, there were too many homes for sale during the housing crisis (many of which were short sales and foreclosures), and that caused prices to fall dramatically. Supply has increased since the start of this year, but there’s still a shortage of inventory available overall, primarily due to almost 15 years of underbuilding homes.
The graph below uses data from the National Association of Realtors (NAR) to show how the months’ supply of homes available now compares to the crash. Today, unsold inventory sits at just a 3.2-months’ supply at the current sales pace, which is significantly lower than the last time. There just isn’t enough inventory on the market for home prices to come crashing down like they did last time, even though some overheated markets may experience slight declines.

Mortgage Standards Were Much More Relaxed Back Then
During the lead-up to the housing crisis, it was much easier to get a home loan than it is today. Running up to 2006, banks were creating artificial demand by lowering lending standards and making it easy for just about anyone to qualify for a home loan or refinance their current home.
Back then, lending institutions took on much greater risk in both the person and the mortgage products offered. That led to mass defaults, foreclosures, and falling prices. Today, things are different, and purchasers face much higher standards from mortgage companies.
The graph below uses Mortgage Credit Availability Index (MCAI) data from the Mortgage Bankers Association (MBA) to help tell this story. In that index, the higher the number, the easier it is to get a mortgage. The lower the number, the harder it is. In the latest report, the index fell by 5.4%, indicating standards are tightening.

This graph also shows just how different things are today compared to the spike in credit availability leading up to the crash. Tighter lending standards over the past 14 years have helped prevent a scenario that would lead to a wave of foreclosures like the last time.
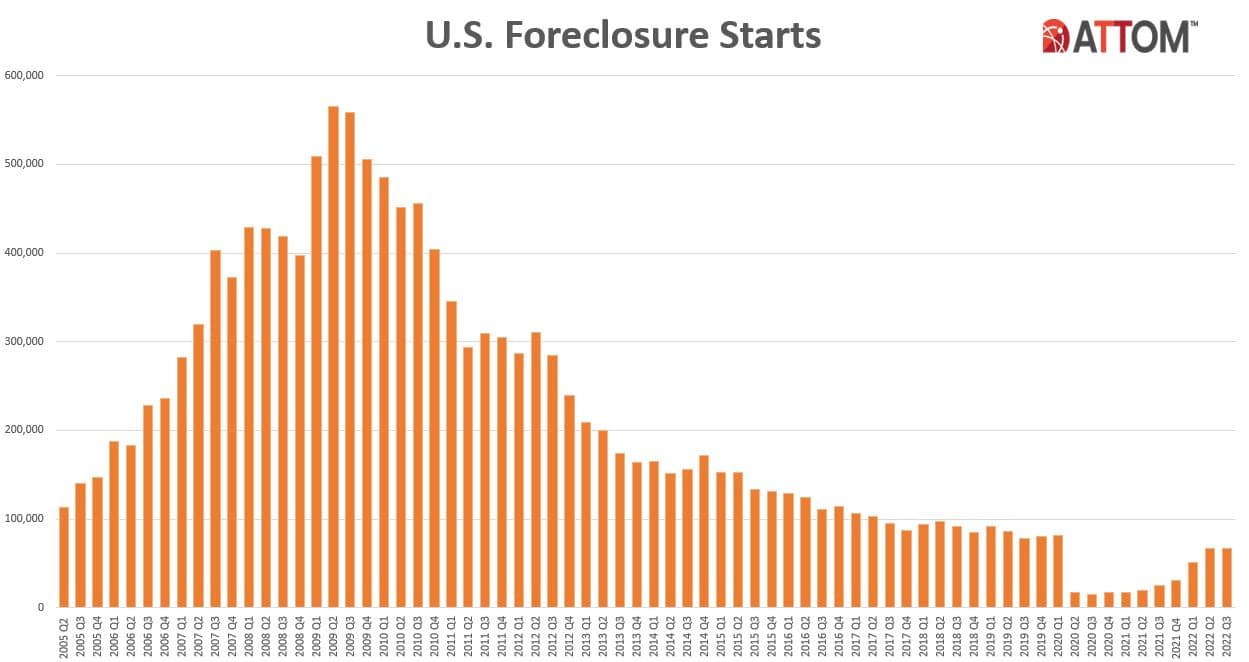
The Foreclosure Volume Is Nothing Like It Was During the Crash
Another difference is the number of homeowners that were facing foreclosure after the housing bubble burst. Foreclosure activity has been lower since the crash, largely because buyers today are more qualified and less likely to default on their loans. The graph below uses data from ATTOM Data Solutions to help paint the picture of how different things are this time:

Not to mention, homeowners today have options they just didn’t have in the housing crisis when so many people owed more on their mortgages than their homes were worth. Today, many homeowners are equity rich. That equity comes, in large part, from the way home prices have appreciated over time. According to CoreLogic:
“The total average equity per borrower has now reached almost $300,000, the highest in the data series.”
Rick Sharga, Executive VP of Market Intelligence at ATTOM Data, explains the impact this has:
“Very few of the properties entering the foreclosure process have reverted to the lender at the end of the foreclosure. . . . We believe that this may be an indication that borrowers are leveraging their equity and selling their homes rather than risking the loss of their equity in a foreclosure auction.”
This goes to show homeowners are in a completely different position this time. For those facing challenges today, many have the option to use their equity to sell their house and avoid the foreclosure process.
Bottom Line
If you’re concerned we’re making the same mistakes that led to the housing crash, the graphs above should help alleviate your fears. Concrete data and expert insights clearly show why this is nothing like the last time.
Upcoming Events
- EAPL 5k Zombie Run- Run and raise money for the Evergreen Animal Protective League, and you might as well adopt a cat too.
- REZZ 10/27- Rock out with REZZ, the undisputed female leader of the electronic music world.
- BOO-rific Bash & Splash- Ready for some indoor trick-or-treating with the whole fam? Kids dress in full costumes and trick-or-treat with local businesses!
- Boogie At the Barn Halloween- Let’s boogie and donate money for various local causes.
- Nightmare Before Christmas Performance- Head over to Peak Academy of Dance and get in the Halloween spirit while watching some haunting moves!
- Denver's 45th Film Fest- Hollywood is coming to town! If you’re into movies, this event is for you.
- Halloween 2022 in Evergreen- Come one, come all! Haunted ghost tours, spooky thrills, and Halloween parades coming right up.


